Integrating NGINX Logs with the ELK Stack: A Comprehensive Guide
16 minutes

Introduction
In this article, we’re diving into the world of NGINX log analysis with ELK stack - a short for Elasticsearch, Logstash, and Kibana and a powerful trio that'll turn your NGINX logs into a goldmine of insights.
NGINX logs contain valuable information about web server traffic, performance, and potential issues. Therefore, If you are running a website using NGINX and without a proper log analysis, you are essentially in the dark - no way to find the root cause for slow page load time, high error rates, and so on.
But by analyzing NGINX logs with ELK stack in real time you are in full control over your website and will enable you to address performance and security issues effectively.
This guide will explore the steps involved in integrating NGINX logs with the ELK Stack. We'll discuss all aspects, including grasping the format of NGINX logs, setting up the ELK Stack, exporting NGINX logs, and analyzing and displaying NGINX logs using the ELK Stack throughout the process.
Understanding NGINX Logs and the ELK Stack
Let's break down the basics of NGINX log formats and the ELK Stack. While NGINX is handling requests and serving up content, it's also keeping a detailed diary. This diary comes in two main flavors:
Access logs: Every time someone visits your website, NGINX jots down details like who they are, what they looked at, and when they stopped by.
Error logs: If something goes wrong in your NGINX server - maybe a page doesn't load or a request gets denied - NGINX makes a note of it here.
Now, these logs are super useful and left on their own, but reading thousands of lines from these log files to find errors is like finding a needle in a haystack. That's where ELK Stack steps in!
The ELK Stack is the most popular and opensource log management and analysis platform to search, analyze, and visualize massive amounts of logs in a single place. It's got three main tools:
- Elasticsearch: A logging database and search engine that can handle massive amounts of data and is freely available for gathering and examining webserver logs. Imagine being able to find a specific needle in a haystack the size of Texas - that's Elasticsearch for you!
- Logstash: Think of Logstash as the data pipeline. It grabs your NGINX logs, prettifies them, and sends them off to Elasticsearch in a searchable format.
- Kibana: This is where the magic happens. Kibana takes all that organized data and turns it into beautiful, interactive visualizations providing you with a picture of your log data!
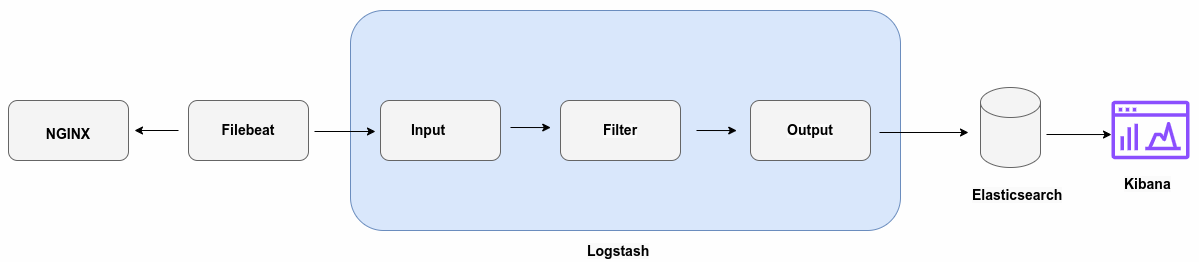
The NGINX log analysis with ELK stack will provide you with real-time knowledge of what is happening with your site. You'll gain instant insight into the activities occurring on your website. By integrating NGINX logs with the ELK Stack, you can see patterns emerging with NGINX logs in real-time with graphs and charts - no more guesswork!
Setting Up the ELK Stack for NGINX Log Integration
Install Elasticsearch
Let's set up the ELK Stack beginning with Elasticsearch up and running. You may need to install the apt-transport-https package on Ubuntu 22.04 before proceeding:
$ sudo apt install apt-transport-httpsNext download and install the public signing key elastic repository:
$ wget -qO - https://artifacts.elastic.co/GPG-KEY-elasticsearch | sudo gpg --dearmor -o /usr/share/keyrings/elasticsearch-keyring.gpgSave the latest elastic repository definition in your system.
$ echo "deb [signed-by=/usr/share/keyrings/elasticsearch-keyring.gpg] https://artifacts.elastic.co/packages/8.x/apt stable main" | sudo tee /etc/apt/sources.list.d/elastic-8.x.listUpdate the repository database and install elasticsearch.
$ sudo apt update && sudo apt install elasticsearchIf everything's gone smoothly, you should see some output on the security configuration indicating that Elasticsearch is installed.
--------------------------- Security autoconfiguration information ------------------------------
Authentication and authorization are enabled.
TLS for the transport and HTTP layers is enabled and configured.
The generated password for the elastic built-in superuser is : 3D2KZqV3rS-cDTzC_iIF
If this node should join an existing cluster, you can reconfigure this with
'/usr/share/elasticsearch/bin/elasticsearch-reconfigure-node --enrollment-token <token-here>'
after creating an enrollment token on your existing cluster.
You can complete the following actions at any time:
Reset the password of the elastic built-in superuser with
'/usr/share/elasticsearch/bin/elasticsearch-reset-password -u elastic'.
Generate an enrollment token for Kibana instances with
'/usr/share/elasticsearch/bin/elasticsearch-create-enrollment-token -s kibana'.
Generate an enrollment token for Elasticsearch nodes with
'/usr/share/elasticsearch/bin/elasticsearch-create-enrollment-token -s node'.
-------------------------------------------------------------------------------------------------
To make the configuration process of the ELK stack shorter, we will configure Elasticsearch without SSL. However, you should proceed with SSL if you are doing it in a production environment.
$ sudo vi /etc/elasticsearch/elasticsearch.yml
…
…
network.host: 0.0.0.0
…
…
# Enable security features
xpack.security.enabled: true
xpack.security.enrollment.enabled: true
# Enable encryption for HTTP API client connections, such as Kibana, Logstash, and Agents
xpack.security.http.ssl:
 enabled: false
 keystore.path: certs/http.p12
# Enable encryption and mutual authentication between cluster nodes
xpack.security.transport.ssl:
 enabled: true
…
…
Enable and start Elasticsearch:
$ sudo systemctl enable elasticsearch.service
$ sudo systemctl start elasticsearch.service
$ sudo systemctl status elasticsearch.service
Test Elasticsearch:
$ curl -u elastic:3D2KZqV3rS-cDTzC_iIF 127.0.0.1:9200
{
 "name" : "ip-172-26-13-83",
 "cluster_name" : "elasticsearch",
 "cluster_uuid" : "D6KWxFnzRLGWvo3W7cXbYg",
 "version" : {
    "number" : "8.15.0",
    "build_flavor" : "default",
    "build_type" : "deb",
    "build_hash" : "1a77947f34deddb41af25e6f0ddb8e830159c179",
    "build_date" : "2024-08-05T10:05:34.233336849Z",
    "build_snapshot" : false,
    "lucene_version" : "9.11.1",
    "minimum_wire_compatibility_version" : "7.17.0",
    "minimum_index_compatibility_version" : "7.0.0"
 },
 "tagline" : "You Know, for Search"
}
Install Kibana
Now, let's move on to Kibana. Since we have already added the elastic GPG key and repository information in the system, install Kibana with the following command.
$ sudo apt install kibanaConfigure Kibana
By default, Elasticsearch is protected with basic authentication, therefore create a user along with a password to perform maintenance on the index during startup.
$ sudo /usr/share/elasticsearch/bin/elasticsearch-reset-password -u kibana_system
This tool will reset the password of the [kibana_system] user to an autogenerated value.
The password will be printed in the console.
Please confirm that you would like to continue [y/N]y
Password for the [kibana_system] user successfully reset.
New value: 9defR6hibcU1hUOz+riC
Now configure Kibana will the following values:
$ sudo vi /etc/kibana/kibana.yml
…
…
server.host: "0.0.0.0"
elasticsearch.hosts: ["http://localhost:9200"]
elasticsearch.username: "kibana_system"
elasticsearch.password: "9defR6hibcU1hUOz+riC"
…
…
Enable Kibana service during boot and start it.
$ sudo systemctl enable kibana.service
$ sudo systemctl start kibana.service
$ sudo systemctl status kibana.service
Once it's up, you should be able to access the Kibana interface by opening a web browser and navigating to http://SERVER_IP:5601.
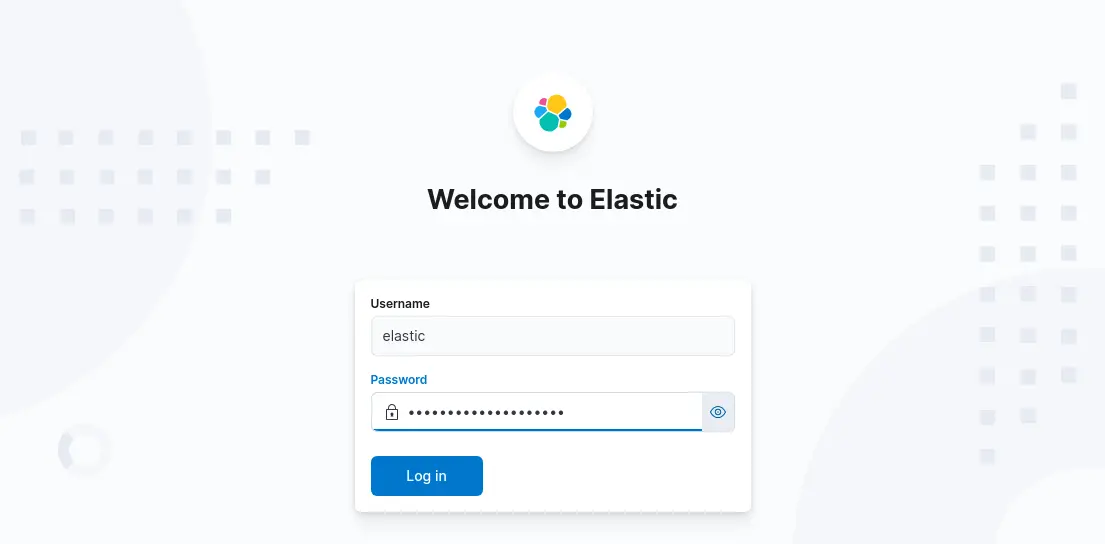
Login with user: elastic and password: your_password
Install Logstash
Install Logstash with the following command.
$ sudo apt install logstashRun the following command to create a systemd start up script for logstash.
$ sudo /usr/share/logstash/bin/system-installWe'll configure Logstash in a bit, but for now, just make sure you can start it up by running:
$ sudo /usr/share/logstash/bin/logstash -e 'input { stdin { } } output { stdout {} }' --path.settings=/etc/logstashIf you see a "Pipeline started" message, you're good to go!
[INFO ] 2024-09-05 09:54:29.587 [[main]-pipeline-manager] javapipeline - Pipeline started {"pipeline.id"=>"main"}Make sure the folder /var/log/logstash is owned by logstash and writable. If not, then change the ownership of this folder to logstash with write permission.
$ ls -l /var/lib/logstash/
total 16
drwxr-xr-x 2 logstash logstash 4096 Sep  7 15:36 dead_letter_queue
drwxr-xr-x 3 logstash logstash 4096 Sep  7 15:36 geoip_database_management
drwxr-xr-x 2 logstash logstash 4096 Sep  7 15:36 queue
You've now got the ELK Stack up and running, ready to receive NGINX log events. In the next section, we'll configure NGINX to play nice with our new setup.
Configuring NGINX for Optimal Logging
Now that we've got our ELK Stack up and running, it's time to configure the access and error log format of NGINX. By default, NGINX uses a pretty basic format for its access logs. However, we want to spice up the NGINX log format with a custom configuration that suits our requirements.
To spice up NGINX log format, we will enable necessary logging modules. NGINX is pretty awesome out of the box, but sometimes we need to add a few extra ingredients to our logging recipe. Here are a couple of modules you might want to consider:
- http_realip_module: This module allows NGINX to use the real IP address of the client, even if it's behind a proxy.
- http-geoip2: Want to know where your visitors are coming from? This module can help!
Check if these two modules are installed along with NGINX with the following command:
$ nginx -V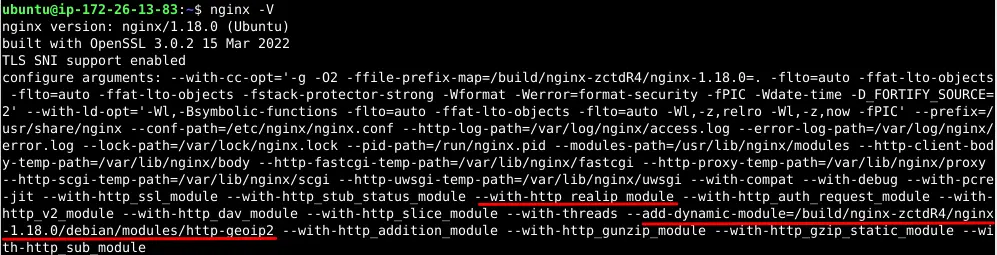
Remember to recompile NGINX with these modules if they're not already included in your installation.
Open your NGINX configuration file. This is usually located at /etc/nginx/nginx.conf, but it might be different depending on your setup.
Look for the http block, and add (or modify) the following lines:
http {
       ...
       ...
       log_format main 'timestamp="$time_local" server_name="$server_name" '
              'method="$request_method" url="$request_uri" userid="$remote_user" '
              'status="$status" client="$remote_addr" '
              'bytes_sent="$bytes_sent" body_bytes_sent="$body_bytes_sent" '
              'referer="$http_referer" '
              'user_agent="$http_user_agent" '
              'request_time="$request_time" '
              'geoip2_country_code="$geoip2_data_country_code" '
              'geoip2_country_name="$geoip2_data_country_name"';
       access_log /var/log/nginx/custom-access.log main;
       error_log /var/log/nginx/custom-error.log;
       ...
       ...
}
A suitable NGINX log format will allow you to locate and view the relevant log data you are seeking. Here the log format includes:
- The client's IP address ($remote_addr).
- The time of the request ($time_local).
- The actual request ($request).
- The status code ($status).
- The size of the response ($body_bytes_sent).
- The referrer ($http_referer).
- The user agent ($http_user_agent).
- The request processing time ($request_time).
- The upstream response time ($upstream_response_time).
- GeoIP country code ($geoip2_data_country_code).
- GeoIP country name ($geoip2_data_country_name).
Save the file. Do not start/restart NGINX at this moment otherwise you will get an error about unknown "geoip2_data_country_code" variable until we install libmaxminddb GeoIP database in the next section.
Get the Maxmind GeoIP database
Maxmind is primarily recognized for providing software designed to prevent fraud, but its main expertise lies in creating and sharing databases that map IP addresses to their corresponding locations. Get it installed on your server.
$ sudo add-apt-repository ppa:maxmind/ppa
$ sudo apt update
$ sudo apt install libmaxminddb0 libmaxminddb-dev mmdb-bin
Sign up for a max-mind account and after 2FA, download the database and extract it. Copy the GeoLite2-City.mmdb and GeoLite2-Country.mmdb to a newly created folder.
$ sudo mkdir /var/maxmindNow put just the mmdb files in there.
$ sudo mv ./GeoLite2-City_2024****/GeoLite2-City.mmdb /var/maxmind
$ sudo mv ./GeoLite2-Country_2024****/GeoLite2-Country.mmdb /var/maxmind
Test the database.
$ mmdblookup --file /var/maxmind/GeoLite2-City.mmdb --ip <some ip address>Configure NGINX to do GeoLocation lookup automatically. Edit the NGINX configuration file and add the following in the NGINX HTTP block.
http {
…
…
##
# GeoIp country
##
geoip2 /var/maxmind/GeoLite2-Country.mmdb {
   $geoip2_data_country_name country names en;
   $geoip2_data_country_code country iso_code;
}
##
# GeoIp city
##
geoip2 /var/maxmind/GeoLite2-City.mmdb {
   $geoip2_data_city_name city names en;
}
…
…
}
Restart NGINX and generate few access log entries by accessing your site.
$ sudo systemctl restart nginxTail the NGINX access log to verify that the actual log entry conforms with the custom NGINX log format that we configured previously.
timestamp="06/Sep/2024:13:23:01 +0000" server_name="_" method="HEAD" url="/Core/Skin/Login.aspx" userid="-" status="404" client="43.129.169.161" bytes_sent="167" body_bytes_sent="0" referer="-" user_agent="Mozilla/5.0 (Windows NT 10.0; Win64; x64) AppleWebKit/537.36 (KHTML, like Gecko) Chrome/106.0.0.0 Safari/537.36" request_time="0.000" geoip2_country_code="HK" geoip2_country_name="Hong Kong"
This is everything needed for nginx to pull in IP-based geolocation information. Now, let's talk about some best practices for log file management.
Log rotation
You don't want NGINX logs to grow endlessly and eat up all your disk space. Set up a log rotation retention policies using a tool like logrotate. Here's how we can use Logrotate and configure it for NGINX.
$ sudo apt install logrotate
$ sudo vi /etc/logrotate.d/nginx
/var/log/nginx/*.log {
       daily
       missingok
       rotate 14
       compress
       delaycompress
       notifempty
       create 0640 www-data adm
       sharedscripts
       prerotate
               if [ -d /etc/logrotate.d/httpd-prerotate ]; then \
                       run-parts /etc/logrotate.d/httpd-prerotate; \
               fi \
       endscript
       postrotate
               invoke-rc.d nginx rotate >/dev/null 2>&1
       endscript
}
Test the configuration.
$ sudo logrotate -d /etc/logrotate.d/nginxIf there are no errors, the NGINX log rotation is configured successfully.
Separate logs for different virtual hosts
If you're hosting multiple sites on one NGINX server, keeping their logs separate is a good idea. In your server block, add:
access_log /var/log/nginx/yoursite.com.access.log;
error_log /var/log/nginx/yoursite.com.error.log;
Use buffer for access logging: This can help reduce disk I/O. Add this to your http block:
access_log /var/log/nginx/access.log detailed_logs buffer=32k flush=5s;The NGINX logs are now configured and ready for the ELK Stack to work their magic. In the next section, we'll set up Filebeat to ship these beautifully formatted logs to Logstash.
Using Filebeat to Ship NGINX Logs
In this section we will explore log shipping with filebeat. Given that NGINX's logs are set up with a custom log format, it's now the time to ship them to the ELK Stack via Filebeat.
Let's get Filebeat installed. Download Filebeat and install it using dpkg.
$ curl -L -O https://artifacts.elastic.co/downloads/beats/filebeat/filebeat-8.15.0-amd64.deb
$ sudo dpkg -i filebeat-8.15.0-amd64.deb
Next, configure Filebeat to collect and ship NGINX logs to the ELK stack.
$ sudo vi /etc/filebeat/filebeat.yml
…
…
# ============================== Filebeat modules ==============================
filebeat.config.modules:
 # Glob pattern for configuration loading
 path: ${path.config}/modules.d/*.yml
…
…
# ------------------------------ Logstash Output -------------------------------
output.logstash:
 # The Logstash hosts
 hosts: ["52.66.204.202:5044"]
…
…
Assuming you are using default nginx settings, configure filebeat to collect and ingest nginx logs to logstash.
$ sudo vi /etc/filebeat/modules.d/nginx.yml
# Module: nginx
# Docs: https://www.elastic.co/guide/en/beats/filebeat/main/filebeat-module-nginx.html
- module: nginx
  # Access logs
  access:
    enabled: true
    # Set custom paths for the log files. If left empty,
    # Filebeat will choose the paths depending on your OS.
    var.paths:
    - '/var/log/nginx/custom-access.log'

  # Error logs
  error:
    enabled: true
    # Set custom paths for the log files. If left empty,
    # Filebeat will choose the paths depending on your OS.
    var.paths:
    - '/var/log/nginx/custom-error.log'
This configuration tells Filebeat to watch NGINX access and error logs and ship log events to Logstash running on port 5044 of logstash server.
Save the file and start Filebeat:
$ cd /etc/filebeat
$ sudo filebeat -e -c filebeat.yml -d "*"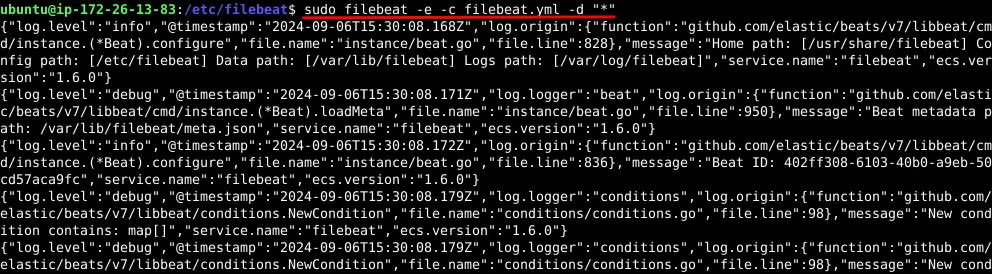
The -e flag tells Filebeat to log to stderr and disable syslog/file output. The -c flag specifies our config file, and -d "*" enables all debugging options. In the console you will see that filebeat is harvesting NGINX log files and ingesting them to logstash. Press CTRL+C when you are done with reviewing the filebeat logs.
Now, it's time to put our Filebeat configuration to the test. However, before we do that, we need to activate the Filebeat systemd service and initiate it.
$ sudo systemctl enable filebeat.service
$ sudo systemctl start filebeat.service
$ sudo systemctl status filebeat.service
Make sure Logstash is running with a basic configuration that accepts Filebeat input and outputs to Elasticsearch. Create a few NGINX log entries by visiting your website or executing the curl command using the following shell script.
$ vi ping_nginx.sh
#!/bin/bash
while :
do
	curl 52.66.204.202
	sleep 1
done
$ chmod u+x ping_nginx.sh
$ ./ping_nginx.sh
Check the Filebeat logs. You should see messages indicating that it's harvesting logs and sending them to Logstash.
$ sudo tail -f /var/log/filebeat/filebeat-events-data-********.ndjsonIf everything's working correctly, Your NGINX logs are now sailing smoothly toward the ELK Stack.
Processing NGINX Logs with Logstash
We've got our logs shipping with Filebeat, and now it's time for Logstash to filter the NGINX logs and turn them into a language that Elasticsearch can understand.
Let's create a Logstash pipeline for our NGINX logs. In your Logstash configuration directory, create a new configuration file called nginx.conf:
$ sudo vi /etc/logstash/conf.d/nginx.conf
input {
 beats {
    port => 5044
 }
}
filter {
    grok {
       match => { "message" => "timestamp=\"%{HTTPDATE:timestamp}\" server_name=\"%{DATA:server_name}\" method=\"%{WORD:http_method}\" url=\"%{DATA:url}\" userid=\"%{DATA:userid}\" status=\"%{NUMBER:status}\" client=\"%{IP:client_ip}\" bytes_sent=\"%{NUMBER:bytes_sent}\" body_bytes_sent=\"%{NUMBER:body_bytes_sent}\" referer=\"%{DATA:referer}\" user_agent=\"%{GREEDYDATA:user_agent}\" request_time=\"%{NUMBER:request_time}\" geoip2_country_code=\"%{DATA:country_code}\" geoip2_country_name=\"%{GREEDYDATA:country_name}\"" }
}
    geoip {
               source => "client_ip"
               target => "geoip"
       }
    mutate { remove_field => [ "message" ] }
}
output {
 elasticsearch {
    hosts => ["localhost:9200"]
    index => "nginx-logs-custom-%{+YYYY.MM.dd}"
    user => "elastic"
    password => "3D2KZqV3rS-cDTzC_iIF"
 }
}
This logstash configuration file is built around three main components: inputs, filters, and outputs and does several things:
Input Plugins: Logstash Input plugins are responsible for ingesting data into Logstash. They can read from various sources including log files, databases, message queues and many more. In our case, logstash accepts input from filebeat on port 5044.
Filter Plugins: Logstash filter plugins process and transform the incoming unstructured data, removes unnecessary fields and prettifies the log events. In this section, grok is used to parse the NGINX logs, adds GeoLocation information based on client IP and removes the original message field. You can leverage this live grok debugger tool to generate and test logstash grok patterns.
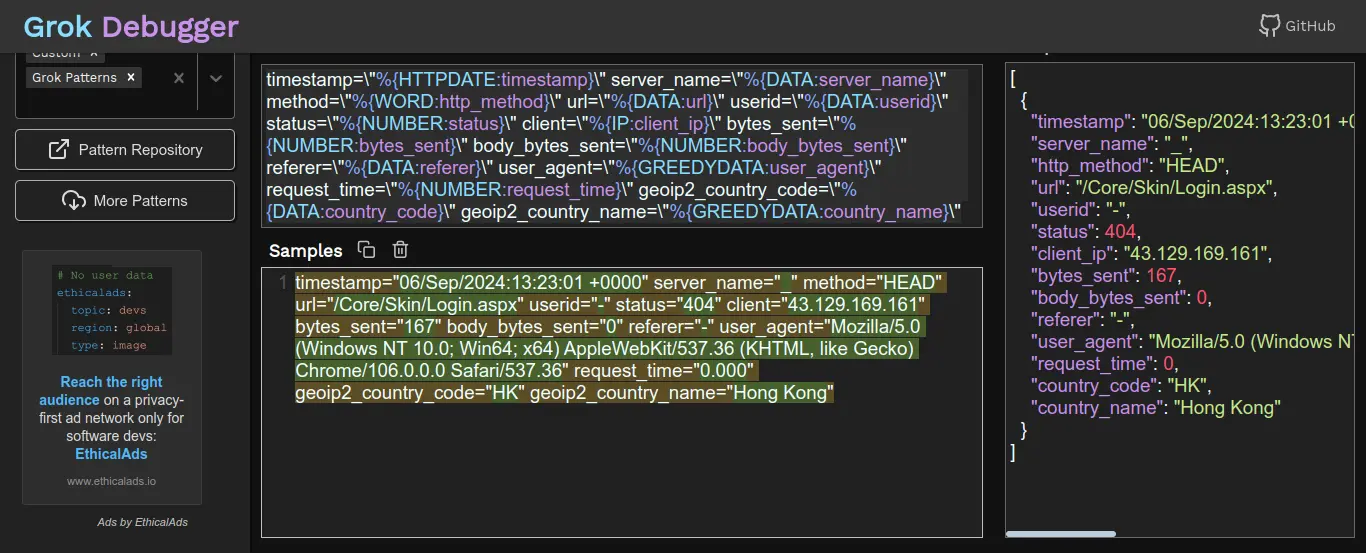
In the above logstash filter, think of grokking as NGINX access log parsing through which you extract only the appropriate log fields.
Output Plugins: The Logstash output plugin is used to send the processed data to various destinations like Elasticsearch, database, message queues and many more.
Do a config test of the Logstash configuration file for any errors.
$ cd /usr/share/logstash/
$ sudo ./bin/logstash --config.test_and_exit -f /etc/logstash/conf.d/ --path.settings=/etc/logstash/
Configuration OK
Start Logstash and enable systemd service for automatic start up during system boot.
$ sudo systemctl start logstash
$ sudo systemctl enable logstash
If everything's set up correctly, you should see Logstash start up and processing of events in the log file.
$ sudo tail -f /var/log/logstash/logstash-plain.logEnriching your data
You can add extra information to your logs. For example, you could add a field indicating whether a request was during business hours. This is how you will do a NGINX log enrichment by adding few more fields!
filter {
 ruby {
    code => "
     time = Time.parse(event.get('@timestamp').to_s)
     event.set('business_hours', time.hour.between?(9, 17))
    "
 }
}
Remember, Logstash is incredibly powerful and flexible. Don't be afraid to experiment and customize your pipeline to fit your specific needs!
Indexing NGINX Logs in Elasticsearch
We've shipped our logs with Filebeat, processed them with Logstash, and now it's time to store them in Elasticsearch. This is where NGINX logs become searchable, analyzable, and visualizable!
First, let's create an elasticsearch index template for our NGINX log data. This will ensure that the log data is mapped correctly:
We will use Kibana to create an elasticsearch index for NGINX. You can also do that by manually creating an NGINX template along with a lifecycle policy. However, we will use Kibana to create an index template.
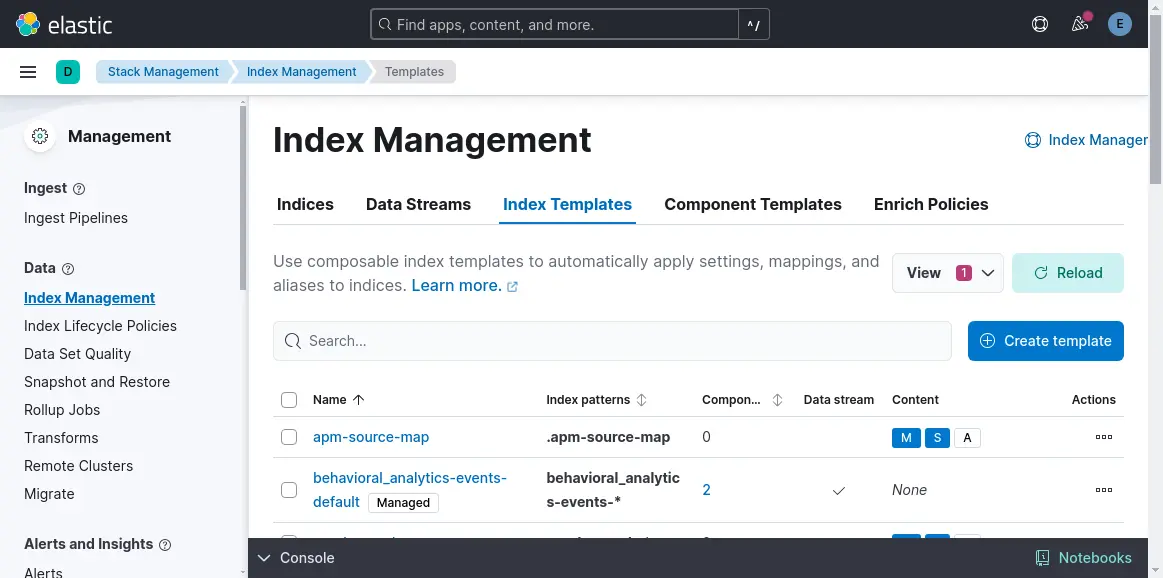
In the Kibana dashboard, click Management->Stack management.
- Click Create template in the Index Templates tab.
- Add a name and index pattern.
- Add settings, mappings, and aliases.
- Add component templates.
You are done with creating elasticsearch index template!
Now your NGINX logs are being indexed in Elasticsearch with proper mapping and lifecycle policies . You're all set to start exploring your data!
Visualizing NGINX Log Data in Kibana
We've collected, shipped, processed, and indexed our NGINX logs. Now it's time to setup kibana dashboards for real-time log visualization of all this fantastic data in Kibana.
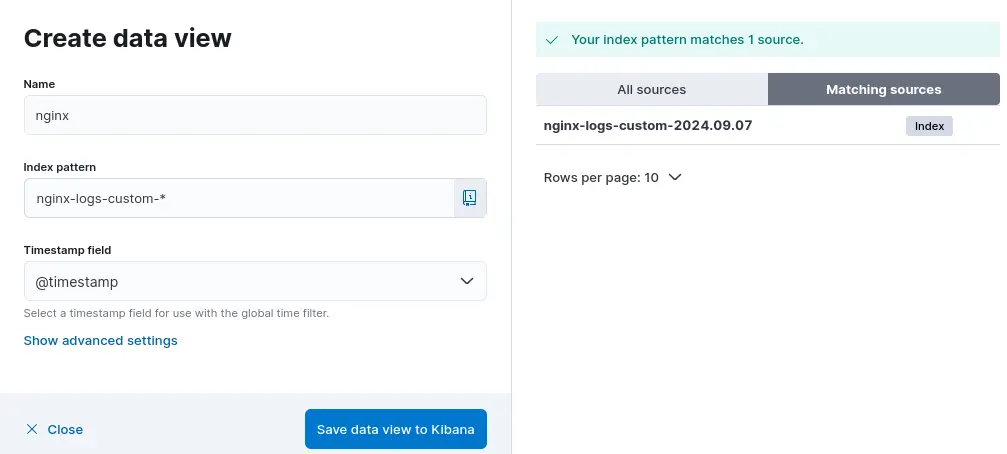
First things first, let's create an index pattern in Kibana. Open Kibana in your web browser (http://SERVER_IP:5601).
- Navigate to Management > Stack Management > Index management > indices
- Click index > nginx-logs-*
- Click Discover index > create data view and save it.
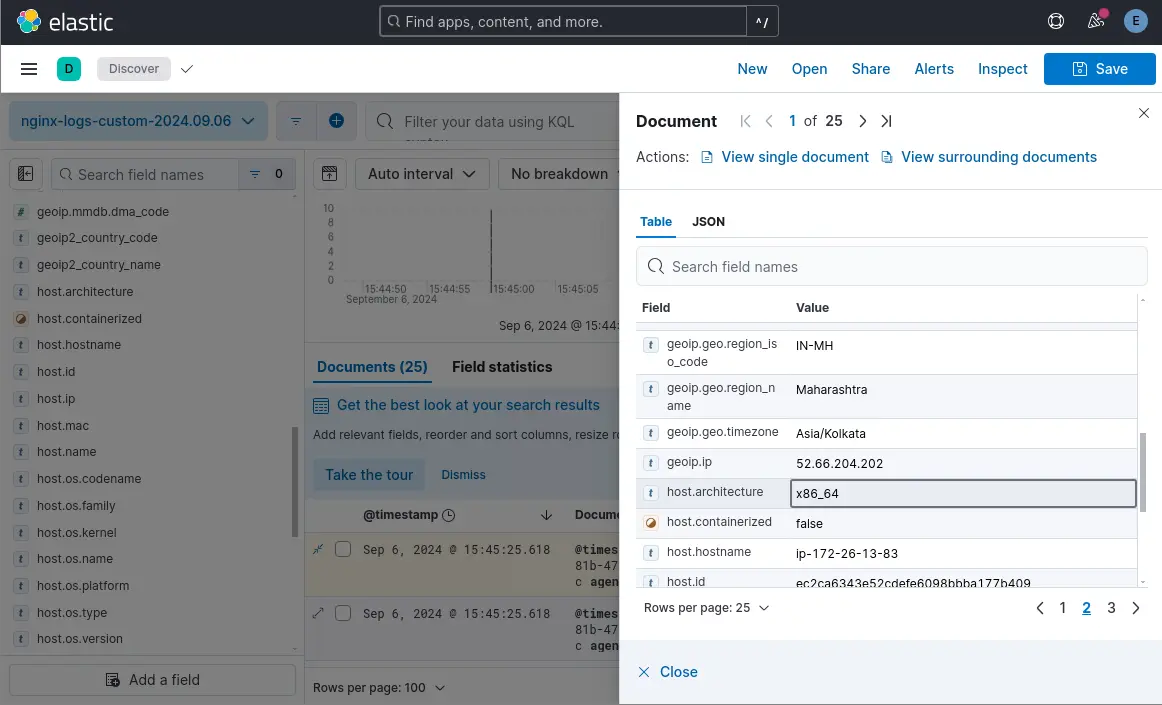
Now, all log events from NGINX will be displayed in the Kibana dashboard. Click a document and search for the fields that you've set up using the NGINX custom log format previously.
Now, let's create some basic visualizations:
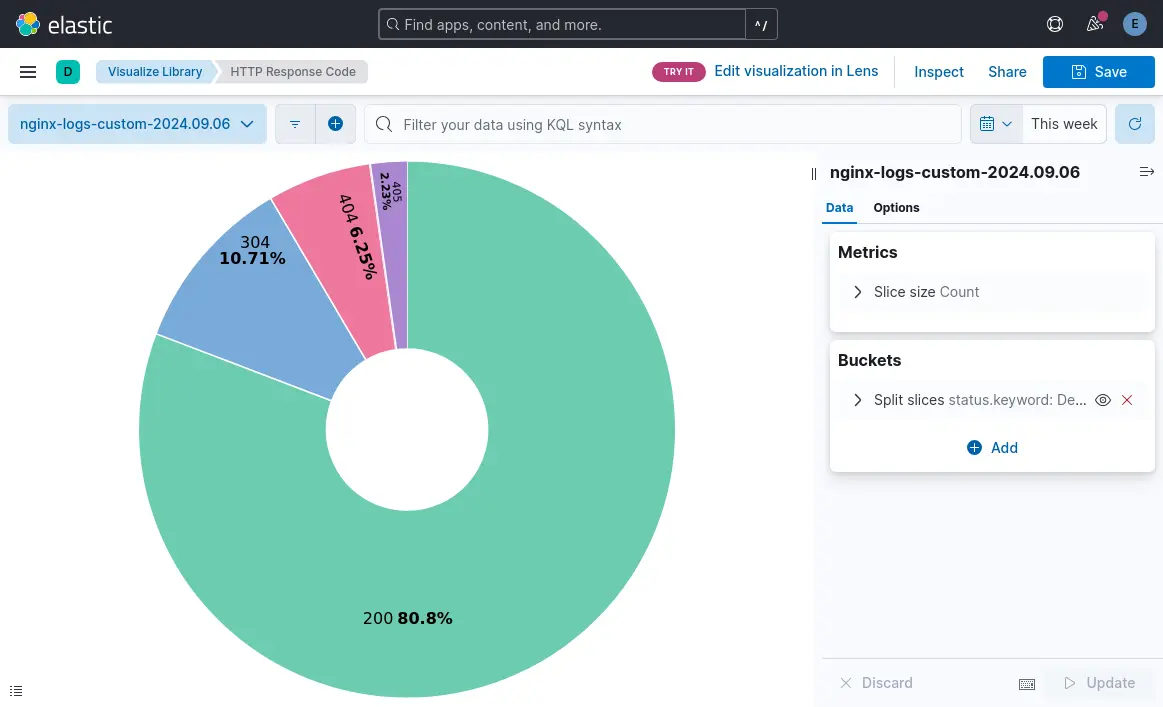
HTTP Status Codes Pie Chart
- Go to Visualize and create a new visualization.
- Click “Aggregation based” and Choose "Pie" as the visualization type.
- Select your nginx-logs-* index pattern.
- For the metrics, choose "Count".
- For buckets, select "Split slices" and choose "Terms" as the aggregation.
- Choose "status.keyword" as the field.
- Click "Update" to see your pie chart of status codes.
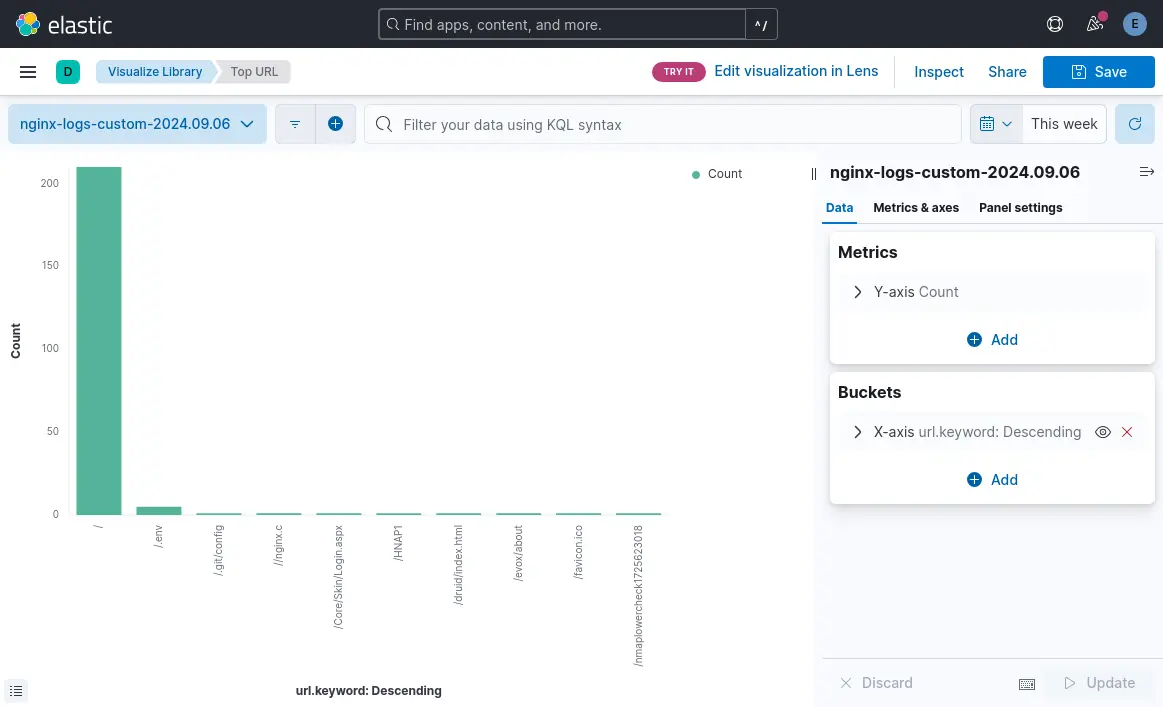
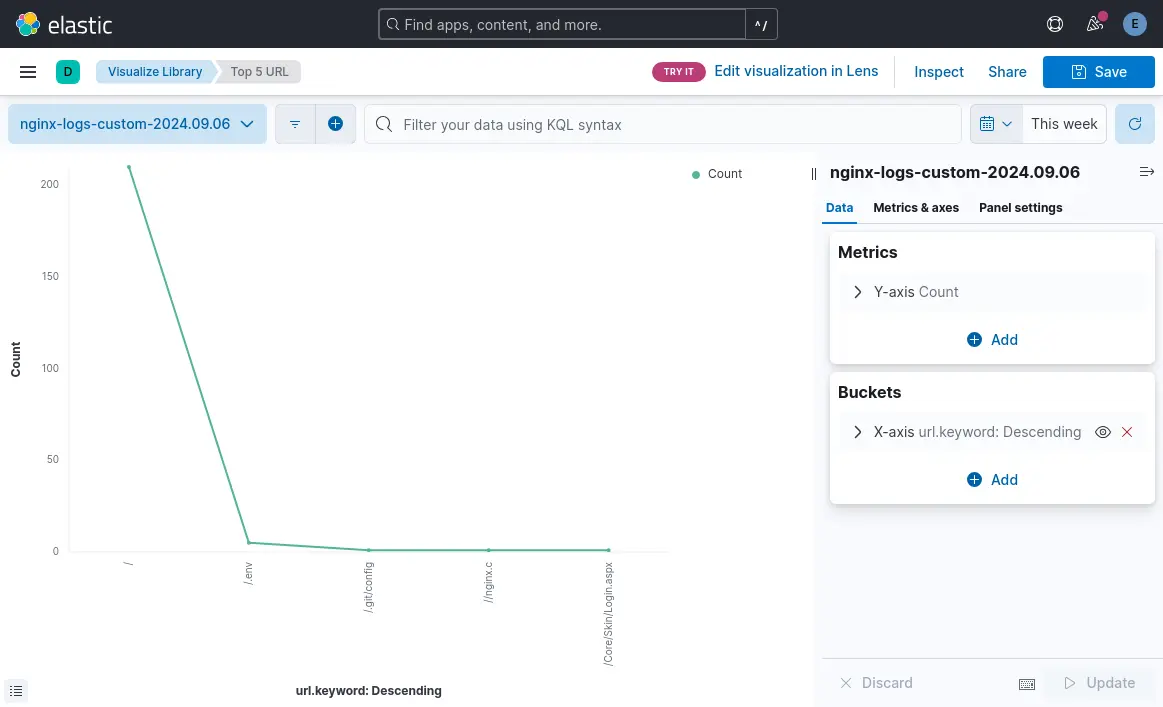
Top 10 URLs Bar Chart
- Click “Aggregation based” and Choose "Vertical bar" as the visualization type.
- Select your nginx-logs-* index pattern.
- For metrics, choose "Count".
- For buckets, select "X-axis" and choose "Terms" as the aggregation.
- Choose "url.keyword" as the field and set the size to 10.
- Click "Update" to see your top 10 URLs.
Request Time Line Graph
- Click “Aggregation based” and Choose "Line" as the visualization type.
- Select your nginx-logs-* index pattern.
- For metrics, choose "Average" and select "request_time" as the field.
- For buckets, select "X-axis" and choose "Date Histogram".Click
These charts will enable you to do a proper analysis of NGINX access or error logs in real time. Now, let's put it all together in a dashboard:
Create Dashboard
- Go to Dashboard and click "Create new dashboard".
- Click "Add" and select the visualizations we just created.
- Arrange them as you like on the dashboard.
- Don't forget to save your dashboard!
Note: Add a time filter to your dashboard to make it easy to zoom in on specific time periods.
Setting up alerts based on log data
The following steps will show you how easily you can setup alerting in ELK stack based on NGINX log events.
- Go to Management > Stack Management > Kibana > Alerting.
- Click "Create alert".
- Choose "Threshold" as the alert type.
- Set up a condition, for example:
- Index pattern: nginx-logs-*
- Aggregation: Count
- Grouping: response_code
- Condition: is above 100
- Time window: 5 minutes
- Set up actions (like sending an email) when the alert triggers.
Remember, these are just starting points. The real power of Kibana comes from exploring your data and creating visualizations that answer your specific questions. Don't be afraid to experiment!
Troubleshooting Common Issues
Even the smoothest sailing ships encounter rough waters sometimes. Let's talk about some common issues you might face and how to troubleshoot them:
Log shipping problems:
- Check Filebeat logs for any errors:
tail -f /var/log/filebeat/filebeat. - Ensure Filebeat has the necessary permissions to read NGINX log files.
- Verify Logstash is running and listening on the correct port.
- Use tcpdump to check if logs are being sent:
sudo tcpdump -i lo port 5044.
Parsing and indexing errors:
- Check Logstash logs for grok failures:
tail -f /var/log/logstash/logstash-plain.log. - Use the Grok Debugger in Kibana to test your patterns.
- Look for mapping errors in Elasticsearch logs:
tail -f /var/log/elasticsearch/elasticsearch.log. - Use the Elasticsearch _analyze API to test how fields are being analyzed.
Optimizing ELK Stack performance for large log volumes:
- Increase Logstash worker threads and pipeline batch sizes.
- Use multiple Elasticsearch nodes and adjust shard count for better distribution.
- Implement index lifecycle management to handle old data.
- Consider using Kafka or Redis as a buffer between Filebeat and Logstash for better scalability.
Conclusion
To sum up, this article will guide you on how to begin NGINX logging journey from raw NGINX logs to a fully-fledged, ELK-powered analytics powerhouse. Let's recap what we've covered:
- Set up NGINX to generate rich, detailed logs.
- Configured Filebeat to ship these logs reliably.
- Used Logstash to parse and enrich NGINX log data.
- Stored NGINX logs in Elasticsearch with proper mapping and lifecycle management.
- Created insightful visualizations in Kibana for NGINX log analysis.
But remember, this is just the beginning! The ELK Stack is a powerful tool, and there's always more to learn and explore topic like machine learning, log anomaly detection, and traces for complete system health to name a few!


 How to Set Up Monitoring and Alerting for NGINX with Prometheus and Grafana
8 minutes / Sep ' 03 2024
 What is NGINX Load Balancing? A Beginner's Guide to Boosting Website Performance
11 minutes / Sep ' 01 2024